
Finance
"To succeed financially, how should we appear to our shareholders?" Revenue, EBITDA and cost synergy run-rate, quarterly target against actual.
Feature · Balanced Scorecard
A Balanced Scorecard is usually a quarterly assembly job: somebody collects the numbers, somebody else formats them, and the strategy map ends up as a slide rather than a system. Here it is a live surface, and the perspective that measures execution reads the execution.
Internal Process populates from the work plan you are already running, so the perspective most likely to be stale is the one nobody has to maintain.
Available on every tier from Independent up. No add-on required.
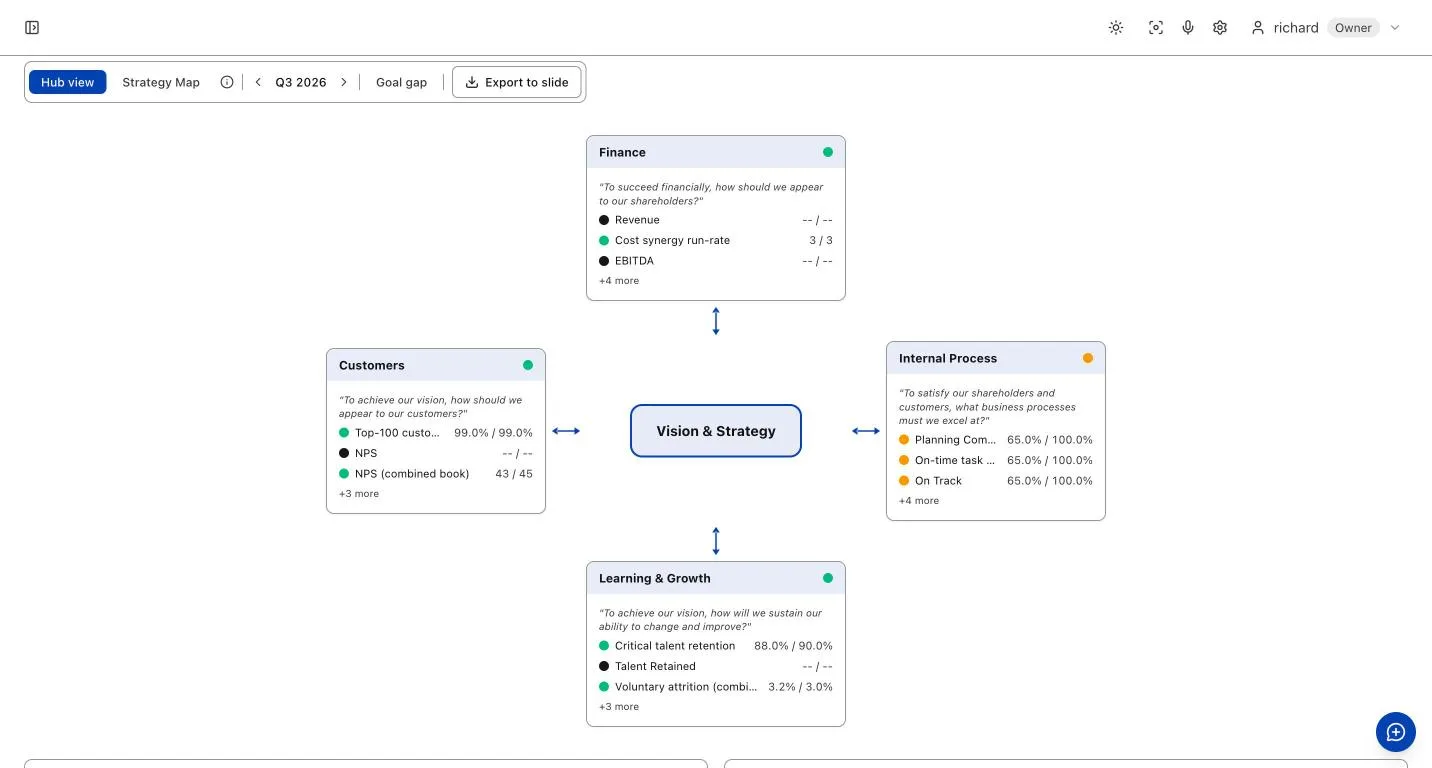
The four perspectives, wired to the programme rather than to a spreadsheet.
"To succeed financially, how should we appear to our shareholders?" Revenue, EBITDA and cost synergy run-rate, quarterly target against actual.
Retention, NPS and the combined book, tracked through the integration rather than reconstructed after it.
Planning completion, on-time task rate and on-track workstreams. This one AUTO-POPULATES from your work plan. Nobody types it.
Critical talent retention, voluntary attrition and capability build, on the same quarterly cadence as everything else.
The four perspectives arranged around Vision & Strategy, with RAG at perspective level so a board sees where to look first and drills from there.
The map and its measures go into the steering pack as a slide, generated from the same numbers the screen is showing.
Set it once. Most of it then maintains itself.
Once
Choose the measures that matter for this programme and set quarterly targets. The four perspectives arrive with a starting set.
Continuously
Internal Process updates itself as the work plan moves: planning completion, on-time tasks, on-track workstreams.
Quarterly
Type the actuals for Finance, Customers and Learning & Growth. Three perspectives, not four.
Quarterly
Goal gap shows where target and actual diverge, and Export to slide puts the map straight into the steering pack.
No, and the distinction matters. BI tools cover dashboards. This is a Balanced Scorecard in the Kaplan and Norton sense: four perspectives around a strategy, with targets you set and a status you can defend to a board.
Internal Process. Planning completion, on-time task rate and on-track workstreams read your work plan directly. Finance, Customers and Learning & Growth are entered quarterly, because we do not have your revenue or your attrition.
Because it is a sandbox nobody typed into, and it shows the split honestly: the perspective that populates itself is full, and the three you enter are empty. On a real programme you fill those in once a quarter.
Yes. The four perspectives are fixed, which is what makes it a Balanced Scorecard rather than a list of metrics, and the measures inside each are yours to set.
All of them, from Independent Sponsor up. It is not an add-on and it is not gated.
14-day free trial. Balanced Scorecard on every tier. SOC 2 Type II observation underway · 75 patents filed.
Start free trial