
Operational and financial, together
The attainment of synergies and the financial levers, growth, margin, multiple, and leverage, on one reconciled waterfall. The total value, not half of it.
Feature · Atlantic Deal Value Bridge
The Atlantic Deal Value bridge puts the attainment of synergies and the financial levers on a single waterfall, and keeps it live. Anticipated value updates as information reaches the transformation program, not once a quarter.
Available as a Value Creation project type or a Deal Value module on Integration and Divestiture. Validated across 34 public case studies.
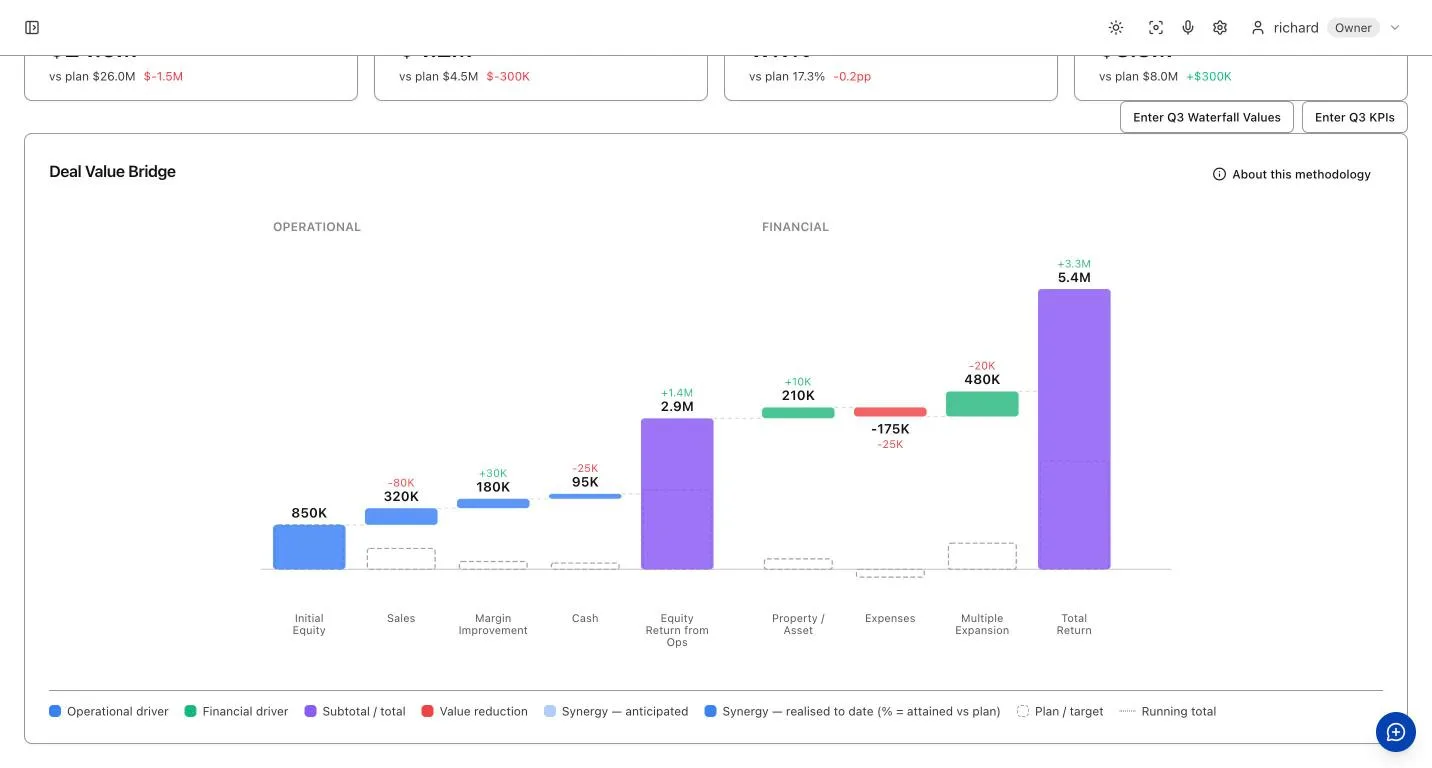
A live value bridge that ties operational attainment to the financial model, not a static chart you rebuild by hand.
The attainment of synergies and the financial levers, growth, margin, multiple, and leverage, on one reconciled waterfall. The total value, not half of it.
Anticipated value recomputes as decisions and progress surface in your transformation meetings. Meeting Intelligence reads them live and attributes them to the operational value legs, so the bridge reflects the deal today, not the last quarterly pack.
Revenue synergies land on the growth leg, cost synergies on the margin leg. The synergy plan is the operating value in the bridge, ramped to realization.
Each leg overlays its anticipated height, the plan line, and the realized fill, with percent attained, so underwrite and actual read at a glance.
Computed by an LBO engine tied out against 34 public case studies. MOIC, IRR, and returns follow, and the Excel export ties on the same inputs.
Growth, margin, multiple, and leverage are modeled explicitly, the same decomposition set out in the founding LBS dissertation, so you can see which lever carries the return.
The bridge follows the value-creation program through its whole life, updating as it goes.
Set the targets
You enter the plan: growth, margin, multiple, and the synergy vectors. The humans set the number the bridge measures against.
Build the bridge
The engine computes the base and base-plus-synergy runs, resolves each leg, and lays out the anticipated bridge, operational and financial, from entry to exit.
Watch in real time
As information reaches the program, anticipated value recomputes and realized value fills in, with percent of plan attained. No scoring, no recommendation.
Present the story
Export the bridge, the attainment, and the variance to a board-ready deck, or hand the tied-out Excel model to the deal team.
We rebuilt 33 public LBOs from their SEC and Companies House filings and checked the Deal Value engine lands on what happened: the debt and cash at every year end, and the sponsor's return. Read what ties, what does not, and why.
Operational and financial value, live, on a method twenty years in the making and validated across 34 public case studies.
Start 14-day free trial